Earth and its water
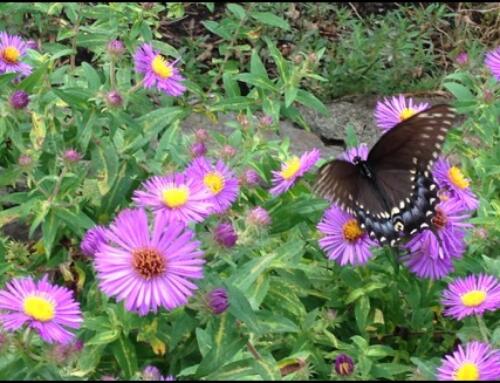
If you live in the mid-west of the United States you might think there is no end to available water. The Ohio River Valley receives about 40 inches of rainfall annually. We are blessed with a plethora of rivers, lakes and streams. Other parts of our country are not so blessed with water and the fact is, we are removing water from our aquifers at a greater rate than the water can be replenished. The figure below shows how we use water taken from aquifers via extraction. The row for irrigation mostly represents irrigation use for agriculture.

Chicago-Milwaukee area: Chicago has been using groundwater since nearly 1864 and groundwater has been the sole source of drinking water for about 8.2 million people in the Great Lakes watershed. This long-term extraction has lowered groundwater levels by as much as 900 feet. (usgs.gov)
“Groundwater usage since the 1960s has more than doubled. Already by the 1960s, people were pumping groundwater faster than it could be replenished by water soaking back into the ground.” Jessica Marshall, Discovery News
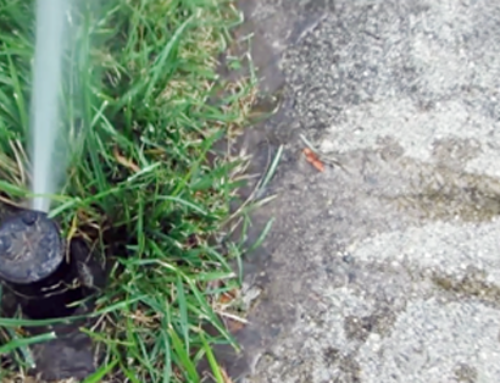
Only about 0.76% of the earth’s total water is fresh water available for human use according to the USGS. Humans continue to put more and more demands on that available fresh water to raise crops in order to feed the world’s population of 6.9 billion people. There is also a high demand for manufacturing use and for human consumption. The figure below shows how water is used in Hamilton County, Ohio by its inhabitants.

In 2003, agriculture accounted for 69 percent of global water use; industry accounted for 23 percent and domestic use accounted for about 8 percent. Thirty percent of US domestic water use is for outdoor use, this number can soar up to 70% in arid regions. http://www.epa.gov/watersense/outdoor/landscaping.html
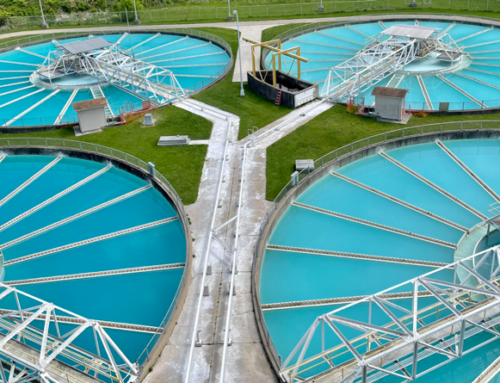
According to the Federal EPA Water Sense program “Managing water is a growing concern in the United States. Communities across the country are starting to face challenges regarding water supply and a need to update aging water treatment and delivery systems, sometimes referred to as “water infrastructure”. Many of the states that have projected population growth increases also have higher per capita water use and can expect increased competition for water resources.” What this all boils down to for you and for me is higher water cost.
Supply and Demand and Waters Rising Costs
Global water requirements are expected to grow by over 50% over the next 20 years, according to a recent report by McKinsey for the 2030 Water Resources Group. By 2030, water withdrawals will exceed natural renewal by more than 60%, mostly at the expense of the water urgently required for the environment. While our collective attention has been focused on depleting supplies of fossil fuels, we have been largely ignoring the simple fact that unless radical changes are made, we will run out of water first and soon. The 2030 Water Resources Group
When looking at the cost of water there are certain factors that influence the price that is charged to the consumers. Let’s look at the cost of water; we have the base cost of producing the water items such as electrical cost, chemicals, employees, infrastructure and all of the general cost of delivering a service and a product. The initial untreated water is generally free or close to free. These are the cost which your water bill payments cover. It is rumored that in many municipal water systems this cost is not fully covered by water rates and that short falls are subsidized by tax revenues. Another cost that is often overlooked is future infrastructure cost. These costs are hard to judge and can be politically unpopular to assess in current billings. Our good friends at the United Nations and the World Bank want to enact tiered water rates. Tiered water rates would work like this; some bureaucrat would determine how much water you needed to survive on a daily basis and you would get charged the lowest rate for up to that amount of water use. If you use more water than that, you would be billed at a higher rate for each level of water use you reached. So, if you liked taking long hot showers you might pay 20% more per cubic foot for water and if you had a swimming pool and an irrigation system and you liked to wash your car with the garden hose you might find yourself paying four times as much for your water. This might all sound like science fiction to you, but my guess is if things don’t change soon we could see this in the next 10 to 12 years in the states.
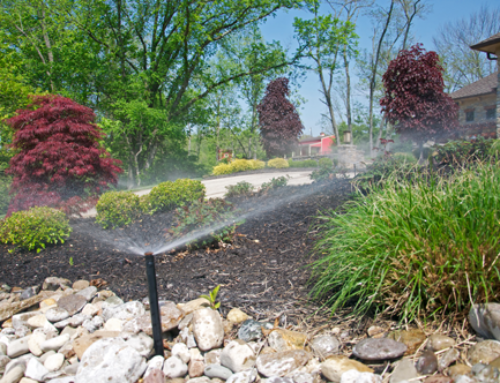
Does that sound a little scary and farfetched? If so, let’s look at something a little more based in facts. The chart below shows the cost of water over a 20 year period pitted against the Consumer Price Index. The bottom line is water prices went up over 289% in 20 years and the rate of increase is growing steadily. With population always on the rise an increase in water demand will always be prevalent.

|


Leave A Comment